Narragansett Bay Time Series History
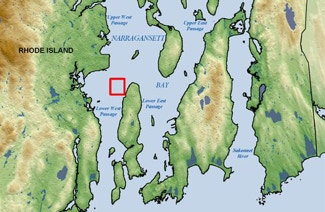
NABATS (Narragansett Bay Time Series) is a four-decade set of weekly measurements of phytoplankton, zooplankton and physical and chemical variables taken at Station II in the lower West Passage of Narragansett Bay, RI. Prof. Ted Smayda began work on the time series in the mid-1950s with Prof. David Pratt. By 1959, Ted expanded the time series to include measurement of phytoplankton rate processes with the goal of using the time series measurements to identify biological, chemical and physical processes that control the abundance and species composition of marine phytoplankton. From 1959 to 1997 Ted secured funding to keep the weekly time series measurements going and his guidance led many students in his “Bunker C” laboratory to use the time series as part of their graduate studies at the URI Graduate School of Oceanography. More than 100 plankton ecology publications related to the time series have been written by Ted, his students and the broader “Bunker C” community.
The Narragansett Bay Time Series is in the tradition of the Norwegian School of phytoplankton ecology, began by H.H. Gran and then T. Braarud, with a species-specific focus on plankton ecology and physiology. NABATS captures the changes occurring in phytoplankton, zooplankton and gelatinous zooplankton (ctenophores) from 1959 to 1997, a period of rapid climate warming of Narragansett Bay. NABATS is one of the longest quantitative plankton time series available for coastal waters globally. The plankton and related measurements available on the NABATS site represent Ted's life work and passion, and have been made available at his request. Please honor the contributions Prof. Smayda has made by properly citing the 1959 to 1997 NABATS data as:
Smayda, T.J. & the Bunker C community (1959-1997). Narragansett Bay Plankton Time Series. Graduate School of Oceanography, URI. Data available at: NABATS.org.
The Measurements
During maximum sampling activity, 27 variables and processes were measured weekly at three depths (top, mid-depth and bottom), plus meteorological observations.
Physical measurements include river runoff, precipitation, wind speed, irradiance (incident and in situ), temperature, salinity, and water mass transparency.
Chemical measurements include NH4, NO3, urea, PO4, Si(OH)4.
Plankton standing stock and physiological measurements include phytoplankton and zooplankton species composition and numerical abundance; phytoplankton biomass as chlorophyll and ATP; zooplankton biomass as dry weight, C and N; gelatinous zooplankton (ctenophore) numerical abundance and biomass; primary production; phytoplankton nutritional status based on nitrate reductase and alkaline phosphatase activity.
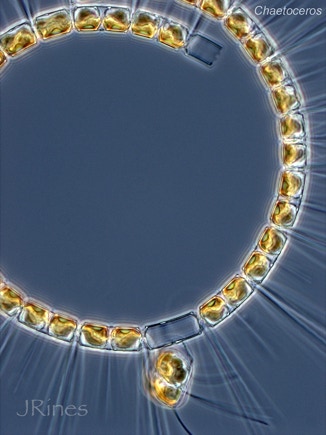
Narragansett Bay Phytoplankton
Images © Jan Rines, not to be reproduced without permission: contact“at”thalassa.org


Station II
Latitude 41° 34' 2" Longitude 71° 23' 4"
Theodore J. Smayda
1932–2017


